Figuring out what counts as the top 5 percent income in Australia in 2022 isn’t as simple as glancing at a tax bracket or a headline number. The numbers can change depending on whether you’re looking at individuals or households, before or after tax, and even where in the country you live. Plus, the way people feel about being ‘rich’ often doesn’t match up with the official stats. Let’s break down what it really means to be in that top 5 percent income bracket in Australia in 2022.
Key Takeaways
- To be in the top 5 percent income Australia 2022, you generally needed to earn around $253,000 or more per year as an individual.
- Household income can paint a different picture, especially when people pool resources or have multiple earners under one roof.
- Where you live matters—a high income in Sydney or Melbourne may not stretch as far as it would in a regional town due to higher living costs.
- Net worth and assets (like owning a home outright or having a large superannuation balance) can make someone feel ‘wealthy’ even if their annual income isn’t in the top 5 percent.
- Public perception of being ‘rich’ often doesn’t line up with official numbers—many Australians earning well above average still see themselves as middle class.
Defining the Top 5 Percent Income in Australia for 2022
To get a real sense of who falls into the top 5 percent of income earners in Australia in 2022, you’ve got to look beyond headline numbers. It’s not just about earning a lot, but also about how income is measured and compared across the country.
Thresholds Used to Identify High-Income Earners
In 2022, hitting the top 5 percent of incomes in Australia typically meant earning at least $180,000 a year before tax. This figure is based on taxable income—basically, what you tell the tax office you earn, not counting tax-free sources like some superannuation payments for retirees. Only around 1 in 20 taxpayers hits this mark each year, making it a pretty exclusive group.
Here’s a quick summary:
| Percentile | Annual Pre-Tax Income |
|---|---|
| 95th | $180,000+ |
| Average Full-Time | $104,765 |
| Median Worker | $67,786 |
So, if your salary hits $180,000, you’re on the doorstep of the top 5 percent. Go much higher and you enter the ultra-high category, where the top 1 percent sits closer to $253,000 or more.
Comparison With Average and Median Incomes
There’s a big difference between average, median, and high incomes in Australia:
- The average full-time wage is about $104,765 a year, but this is skewed up by high earners.
- Median worker income is lower—closer to $67,786—since many Australians only work part-time or are out of the workforce.
- Many people actually earn far less than the figures discussed in headlines.
It’s easy to feel like you’re lagging when hearing about six-figure salaries, but most Australians earn well below these numbers.
Role of Taxable and Disposable Income
How much you earn is one thing; how much you keep is another. Taxable income includes all your official, tax-declared income for the year. Disposable income is what’s left after taxes and compulsory payments (like the Medicare Levy) are taken out.
- Many Australians also receive non-taxable income (superannuation payouts, certain government benefits).
- High earners may see big deductions due to higher marginal tax rates.
- Disposable income paints a clearer picture of spending power, especially for comparing people in different tax brackets.
In short, defining who’s at the top isn’t quite as simple as looking at a single salary figure. It depends on exactly how you measure and compare incomes—and whether you’re talking about gross salary, taxable income, or what’s finally left over in the bank at the end of each year.
Income Distribution and Wealth Gaps Across Australian Households
How Quintiles Illustrate Income Spread
When we talk about income distribution in Australia, quintiles help show the real spread. Households are split into five groups, each making up 20% of all households. The top 20% of households earn more than double the national average household income, while the bottom 20% get by on just a small fraction. Here’s a basic breakdown:
| Quintile | Average Annual Income | Share of Total Income |
|---|---|---|
| Top (5th) | > $280,000 | 48% |
| 4th | $116,000 – $280,000 | |
| 3rd (Average) | ~$116,000 | |
| 2nd | $24,000 – $116,000 | |
| Bottom (1st) | ~ $24,000 | 4% |
- The top group earns almost as much as everyone else put together.
- Highest-quintile households make around 12 times what the bottom group brings in.
- Income is far from evenly split, and most households are somewhere around the middle but well below the top.
Even though many consider Australia a middle-class country, real numbers show a big divide between those at the top and those getting by at the bottom.
Wealth Accumulation and Disparities
Income is just part of the picture. Wealth—things like home values, superannuation, and investments—reveals an even sharper gap. The wealthiest households have accumulated far more, both in absolute terms and relative to the rest:
| Quintile | Average Net Wealth | Share of Private Wealth |
|---|---|---|
| Top (5th) | $3,236,800 | 63% |
| 4th | $1,042,300 | |
| 3rd (Average) | $1,022,200 | |
| 2nd | ||
| Bottom (1st) | $35,200 | 1% |
- The top 20% own the majority of private national wealth.
- The typical household’s net worth is only a fraction of what the wealthiest hold.
- According to research from ACOSS and UNSW Sydney, Australia’s wealth gap keeps growing, making it harder for those lower down to move up (wealth gap is increasing).
Implications of the Gini Coefficient
The Gini coefficient is a way to show how spread out income is—from zero (total equality) to one (complete inequality). Australia’s score sits at roughly 0.439.
- It has ticked up over recent years, meaning gaps have widened.
- Not as unequal as some countries, but the divide is bigger than it was in the 1990s.
- A rising Gini points to wider splits in financial outcomes.
The numbers may sound abstract, but the result is real enough: people in different parts of the income curve end up with very different lifestyles and opportunities.
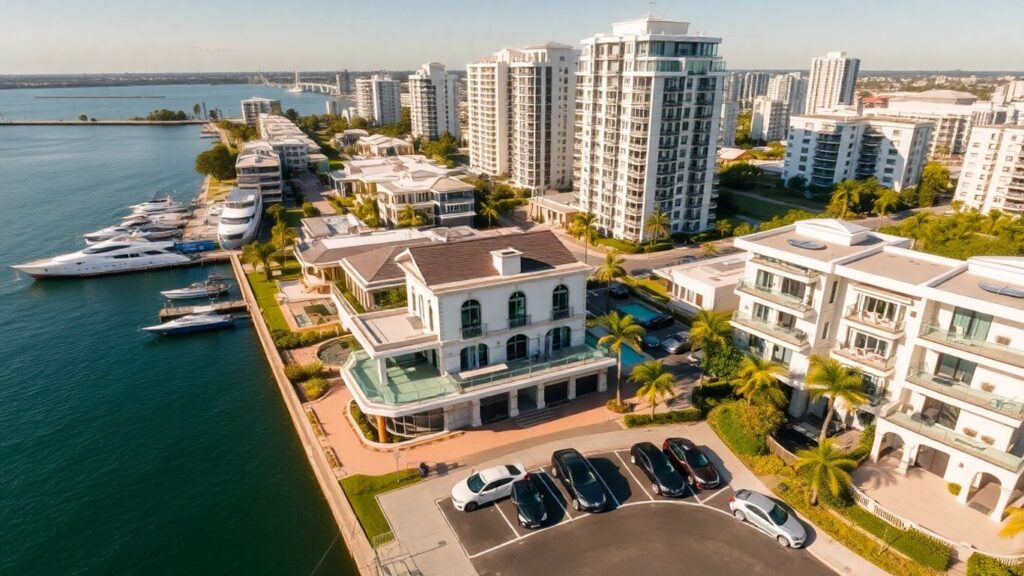
Regional Differences: Where Top Income Earners Live
When talking about Australia’s top 5 percent income earners, location matters as much as salary. Urban centres like Sydney and Melbourne are home to many high-income individuals, but even within those cities, wealth clumps in certain suburbs and council areas. Areas such as Woollahra, North Sydney, and Mosman in NSW, as well as Yarra and Stonnington in Victoria, frequently report the highest median incomes. This pattern echoes in resource-rich regions, with Queensland’s Weipa and Cloncurry and Western Australia’s Karratha standing out due to the mining industry’s impact.
Here’s a look at some leading areas for highest median total income:
| Local Government Area | State |
|---|---|
| Woollahra | NSW |
| North Sydney | NSW |
| Mosman | NSW |
| Yarra | VIC |
| Stonnington | VIC |
| Weipa | QLD |
| Karratha | WA |
| Burnside | SA |
| Hobart | TAS |
| ACT (various suburbs) | ACT |
Cost of Living and Regional Income Variations
A high income doesn’t automatically mean the same thing everywhere. Earning $200,000 in inner Sydney doesn’t stretch as far as it would in a rural town, thanks to sky-high property prices and everyday expenses. In contrast, the same amount in regional areas can put someone in a far more comfortable position. The cost of housing, transport, and even food tracks with local wages, changing what ‘wealthy’ means depending on your postcode.
- Major cities require bigger pay packets to maintain a similar standard of living to smaller towns.
- Property prices are the single biggest factor, with Sydney and Melbourne still topping the charts.
- Public and private service availability can also make a location more (or less) expensive, regardless of average income.
Understanding where your dollar goes locally is just as important as how many dollars you earn when measuring wealth.
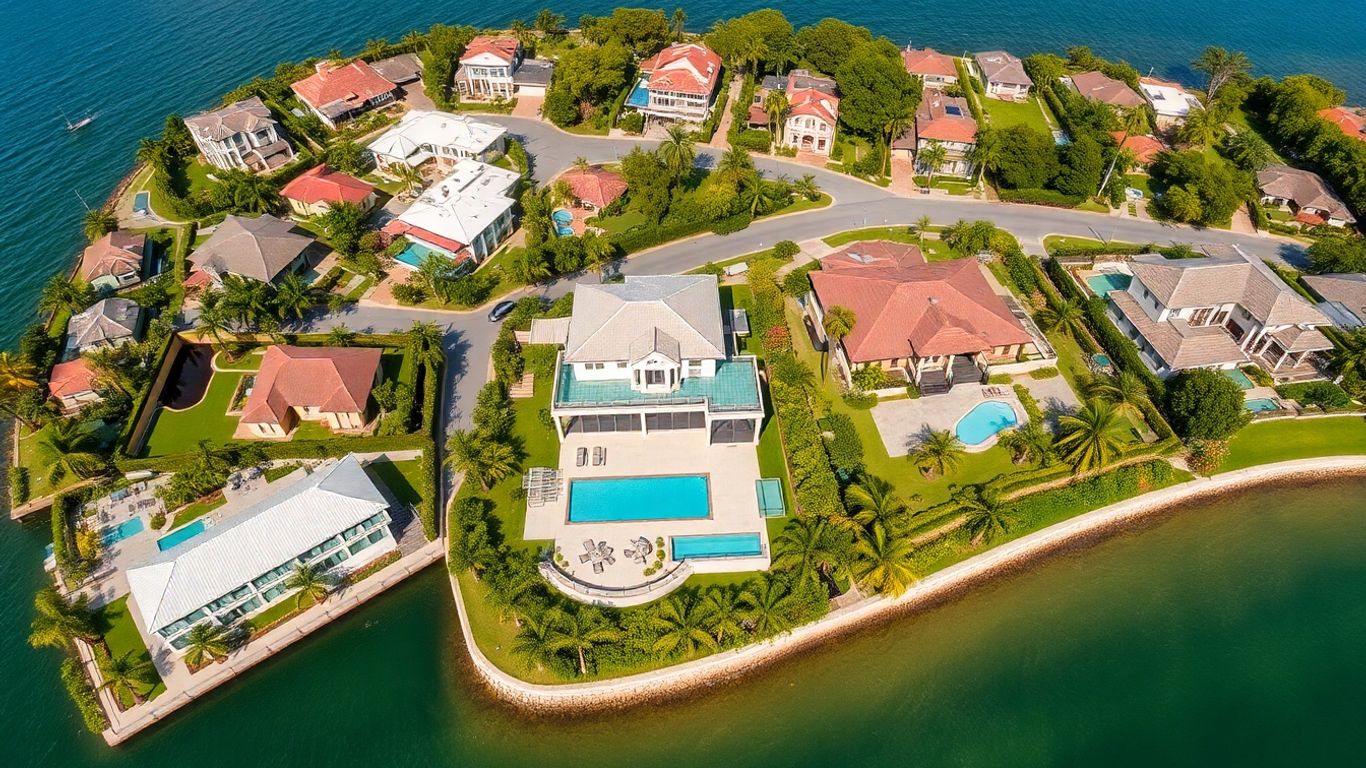
Urban Versus Regional Wealth Patterns
The classic city-versus-country money divide is real. More people in the top income brackets live in urban centres, while regional and remote Australia tend to have fewer high earners relative to population. This links closely with the way Australia’s economy is broken down by state. For example, New South Wales drives a significant chunk of the national economy with over 30% of the contribution (Australia’s economic composition by state), explaining why so many high earners are found there.
A few key differences between city and regional income patterns:
- City households rely more on high-skill, white-collar sectors—think finance, tech and law—while regional areas are shaped by mining, agriculture or tourism.
- Urban incomes are higher on average, but urban expenses rise in tandem, which can water down the feeling of wealth.
- The biggest income gaps, and therefore the sharpest sense of local wealth, often exist in the most expensive cities.
So, where you live truly shapes not only what you earn, but what that earning power means for your day-to-day life.
Net Worth, Assets and Perceptions of Being ‘Rich’
How Net Worth Complements Income Metrics
People often equate ‘rich’ with a high salary, but that’s only one piece of the puzzle. Net worth, which includes everything you own minus your debts, paints a much fuller picture of financial strength. In Australia, much of this wealth is tied up in property, superannuation, and sometimes shares or savings. For many, their biggest asset is the family home, which makes sense given that Australian residential property holds a massive collective value, with real estate being the largest asset class.
Here’s a simple table showing average net wealth by household quintile (the richest 20% to the poorest 20%):
| Household Wealth Quintile | Average Net Wealth ($A) |
|---|---|
| Top 20% | 3,236,800 |
| 2nd 20% | ~1,350,000 |
| 3rd 20% | ~770,000 |
| 4th 20% | ~270,000 |
| Bottom 20% | 35,200 |
Superannuation and Home Ownership Impact
Superannuation and outright home ownership shift the wealth goalposts quite a bit. A retiree with $2 million in retirement savings and a fully paid-off home might see themselves as comfortable, though their actual spending could be modest. In fact:
- Super and property dominate wealth for most Aussies
- Many retirees draw most of their income from the Age Pension, since typical super balances are much lower than headline numbers
- Owning your home means you have less housing stress, especially during retirement
For a lot of people, how "wealthy" you feel depends as much on mortgage-free living as it does on hard numbers in the bank.
Public Perceptions Versus Official Data
What does it actually mean to be ‘rich’ in Australia? The answers are all over the place, depending on who you ask. Some people say it’s all about earning more than $150,000 after tax, others focus on hitting a net worth of $1 million. There are also people who just look at home ownership: having your own house without a loan can be a symbol of wealth.
A few things that skew public perception:
- Comparing to neighbours – what feels rich in regional areas can feel average in parts of Sydney or Melbourne
- Lifestyle choices and debt levels – a big income doesn’t always mean spare cash if expenses are sky-high
- Self-assessment lags reality – surveys show far more people label others as ‘rich’ than see themselves that way
So, whether you use income, net worth or assets, the line between ‘comfortable’, ‘wealthy’ and ‘rich’ is pretty fuzzy. Most people focus less on official brackets and more on their own goals and ability to live stress-free.
Household Income Versus Individual Income Metrics

When thinking about who sits in the top 5 percent of income earners in Australia, it’s not as clear-cut as just looking at individual wages. Equivalised household income provides a more realistic view of a person’s financial comfort by adjusting household earnings for the number of people relying on that income. Basically, it’s an attempt to compare apples with apples, since a single earner supporting three dependents won’t feel as well-off as a solo adult earning the same wage.
- Helps to even out income comparisons between large and small households.
- Adjusts for the economies of scale (shared bills, food, etc.).
- Offers policymakers a clearer picture of inequality.
| Category | Disposable Income (annual) | Equivalised Income (annual) |
|---|---|---|
| Typical Australian HH | $80,262 | $50,146 |
When you adjust for the number of people sharing resources, the measure of comfort changes completely, reminding us that raw income doesn’t tell the full story.
Pooling Resources Within Households
Most Australians don’t just live alone or fend entirely for themselves—there are couples, families, flatmates, and more. People pool their income in different ways, which can stretch a dollar further than if everyone lived separately.
- Households share costs: rent, utilities, groceries, and more.
- Dual or multi-income families often distribute money based on need, not by strict proportions.
- Resource sharing can help soften the blow of job losses or other income shocks.
Pooling also masks some financial realities—for instance, a household with one high-income earner and several adults without their own income might struggle more than the top-line numbers suggest.
Impact of Household Size on Wealth
Household size also plays a role in measured wealth and comfort. Larger households might bring in more total income, but they have more mouths to feed and extra expenses across the board. This means the same amount of total income per household gets stretched thinner as size increases.
- Larger households have higher costs, though they also share fixed expenses.
- The bigger the household, the bigger the gap between gross and equivalised income.
- Wealth metrics, like net assets or superannuation balances, should be divided by number of people to give a clearer picture.
So, when headlines talk about top income earners, always check if they’re thinking in terms of individuals or households. The difference shapes policy debates, social discussions, and even taxation data analysis.
Age, Wealth Accumulation and Retirement Considerations
Wealth in Australia tends to grow with age. Younger Australians often start with little net wealth, but it generally increases steadily as people move through their working years.
Here’s an overview of median net wealth by age group:
| Age Group | Median Net Wealth (approx.) |
|---|---|
| 25-40 | $238,000 |
| 41-64 | $809,000 |
| 65+ | $900,000+ |
Older households usually report more assets because they’ve had longer to save and invest. But it’s not just about earning more. Mortgage repayments, super contributions and regular saving all add up over the decades. People in their peak earning years (often their 40s-60s) see their wealth grow the fastest, often boosted by home equity.
Many people approaching retirement discover that, over time, steady saving and home ownership matter far more than any one big windfall or inheritance.
Superannuation Distribution Among Retirees
Super often forms a large part of retirement plans, but distribution is patchy. A big surprise is that many retirees in Australia today have either little or no super. Here’s a breakdown:
- The typical retired household has about $9,000 in superannuation savings.
- Most current retirees draw most of their income from the Age Pension, not their super.
- Wealthier retirees have much higher super balances, but this group is a minority.
This uneven distribution means that future policy changes, like reducing super tax breaks, mostly impact those with the largest nest eggs, not the majority of retirees.
Home Ownership Among Older Australians
For Australians over 65, the family home is often their single biggest asset. This changes the whole picture of retirement wealth and security:
- Most older households own their homes outright – they bought them years ago at much lower prices and have likely paid off the mortgage.
- Home value often dwarfs any super or savings they might have.
- Home equity is mostly excluded from Age Pension tests, giving homeowners extra security compared to renters.
Older Australians who rent are generally less wealthy and face more financial risk in retirement. This gap means home ownership – even more than superannuation – is a key factor in financial comfort later in life.
Societal Implications of Australia’s Top 5 Percent Income Bracket
Income Inequality and Middle Class Erosion
Over the past decade, talk about inequality in Australia has become more common, and for good reason. The gap between the top 5 percent of earners and the rest of the population has been growing steadily. As high-income earners pull further away, many in the so-called middle class are feeling squeezed, with living costs rising faster than wages for most Aussie households. If we look at income distribution, the highest quintile (top 20%) brings in nearly half of the country’s income, leaving the lowest 20% with just 4%. It’s no surprise people are worried about what it means for fairness and opportunity.
Key effects of this widening gap include:
- More wealth flowing into fewer hands, making intergenerational mobility harder
- Pressure on middle and lower-income households to keep up with housing and lifestyle costs
- Social tension, as people see neighbours doing much better while they struggle to get ahead
For many regular Australians, the idea of the ‘lucky country’ seems less real when the top earners are moving ahead at speeds that feel out of reach.
Policy Considerations and Taxation
The distribution of income means government policies around tax and welfare come under constant debate. Australia’s top tax rate is supposed to target high-income earners, but bracket creep and loopholes can muddy the waters. There’s ongoing tension between wanting to reward hard work and success, and making sure the system doesn’t leave too many behind. Some argue the tax scales are outdated, as they don’t accurately reflect modern earnings or the reality for most people.
Here’s how policy often responds:
- Adjusting tax brackets more frequently to keep pace with inflation and wage growth.
- Exploring wealth taxes or asset-based levies to address the gap between earned income and accumulated wealth.
- Reforming welfare programs to focus more on those falling furthest behind, rather than the broad middle class.
Long-Term Economic Mobility
How easy is it for someone to move into Australia’s top income tier? The answer seems to be: not very. Economic mobility—climbing from the bottom or middle into the top 5 percent—depends on factors like education, family background, and access to property or business opportunities. What’s more, since the top 5 percent often have significant assets outside their regular income (think investment properties and shares), they can pull ahead even faster when markets boom. Data suggests if you weren’t born into wealth, it’s getting harder to get there now than it was a generation ago.
| Quintile (Income) | Avg Net Wealth | % of National Wealth |
|---|---|---|
| Bottom 20% | $35,200 | 1% |
| Second 20% | — | — |
| Third 20% | — | — |
| Fourth 20% | $1,042,300 | — |
| Top 20% | $3,236,800 | 63% |
If the trend continues, Australia could end up more divided along financial lines than it has been in years, with real flow-on effects for social unity and overall wellbeing.
Wrapping Up: What Does It Mean to Be in the Top 5 Percent?
So, after looking at all the numbers and stories, it’s clear that being in the top 5 percent of income earners in Australia isn’t as simple as just hitting a certain salary. Sure, if you’re earning over $250,000 a year, you’re probably there, but there’s a lot more to it. Where you live, how big your household is, and even how you feel about your own finances all play a part. Some people with high incomes don’t feel rich at all, especially if they’re in expensive cities or have big families. Others might feel well-off with less, depending on their situation. At the end of the day, the numbers help us understand the spread, but everyone’s idea of what it means to be ‘rich’ or ‘comfortable’ is different. Maybe it’s less about chasing a number and more about finding what makes you feel secure and happy with your own life.
Frequently Asked Questions
What income do you need to be in the top 5 percent in Australia in 2022?
To be in the top 5 percent of income earners in Australia in 2022, you usually need to earn more than $253,000 a year before tax. This figure can change a bit depending on how income is measured, but that’s a good estimate for 2022.
How does the top 5 percent income compare to the average income in Australia?
The top 5 percent earn much more than the average Australian. While the average full-time worker earns about $104,765 a year, most workers actually make less than that. The top 5 percent earn more than double or even triple what most people do.
Does where you live in Australia affect what counts as a high income?
Yes, where you live makes a big difference. Earning $250,000 in Sydney or Melbourne might not feel as ‘rich’ because of higher living costs, but in regional areas, the same income goes much further. Wealthy suburbs in big cities often have higher income thresholds for the top 5 percent.
Is being in the top 5 percent only about salary, or do assets matter too?
Income is important, but so is what you own. Net worth, including your house, superannuation, and other assets, can make someone feel ‘rich’ even if their yearly income isn’t as high. Some people with lots of assets but lower incomes still feel wealthy.
Why do some people not feel rich even if they earn a lot?
Many Australians compare themselves to others around them. Someone earning a high salary in an expensive city might not feel rich because their neighbours earn even more, or because their living costs are high. Also, debts and lifestyle choices can make a big income feel smaller.
How does household size affect whether you’re in the top 5 percent?
If you live in a big household, your income has to stretch further. That’s why experts use ‘equivalised’ income, which adjusts for household size. A family of five needs more money than a single person to have the same standard of living, so household size is important when thinking about wealth.